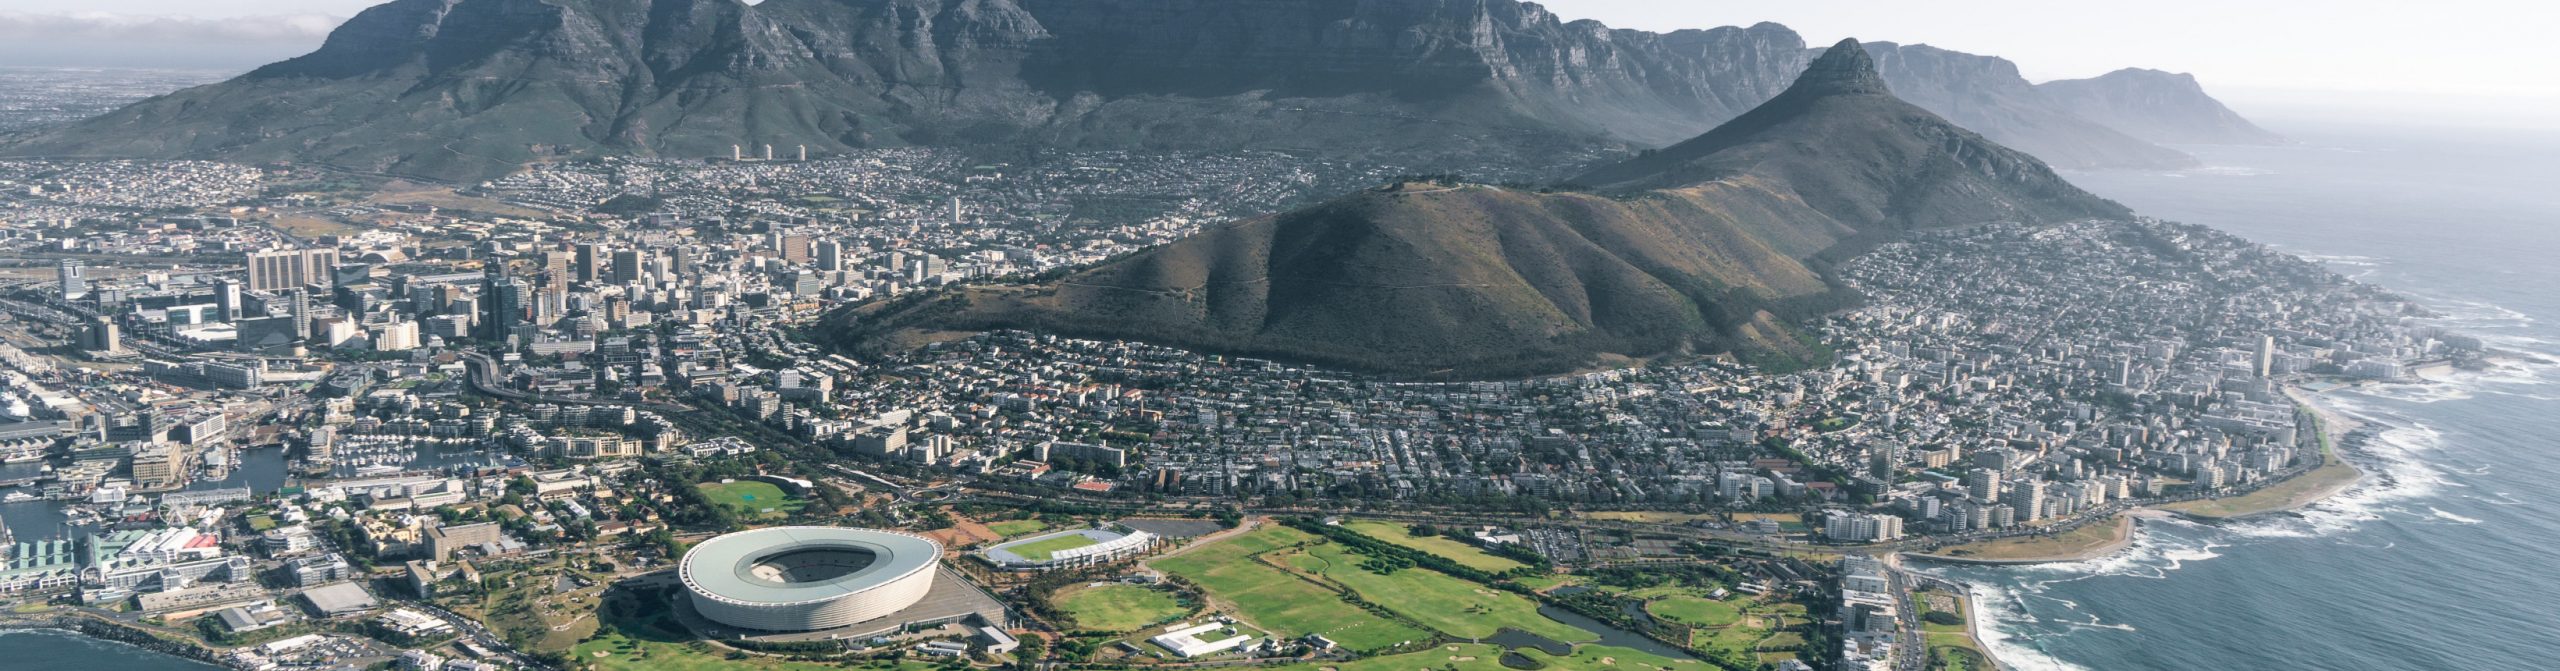
South Africa Economic Outlook
Regional heavyweight:
South Africa is one of the wealthiest countries in Africa in GDP per capita terms. Moreover, South Africa's industrial sector is relatively well-developed compared to other African countries, contributing over 10% of GDP. Key manufacturing areas include automotive, machinery, mining equipment, textiles, and processed foods.
Mining strength:South Africa is rich in natural resources, with significant reserves of gold, diamonds, platinum, coal, and iron ore. While the mining sector's contribution to GDP has declined in recent years, it remains an important source of export earnings.
Dynamic demographics:The population is currently growing by 1–2% per year and is forecast to rise by around five million between 2022 and 2027. While this boosts the size of the domestic market, boding well for private consumption, it also brings challenges relating to providing sufficient jobs and avoid bouts of social instability.
Multiple economic challenges:South Africa grapples with significant challenges, including high unemployment, poverty, and inequality, with the latter still marked by the legacy of apartheid. Additionally, issues like crime, corruption, and political uncertainty have an impact on the investment climate and economic stability. Moreover, in recent years, the country has suffered from frequent power disruptions and rolling electricity blackouts (known locally as load shedding), which have weighed on economic activity. The national unity government formed in mid-2024 between several political parties will likely be unable to bring about comprehensive solutions to most of these challenges.
South Africa's economic outlook:The economy is forecast to grow far more slowly than the regional average in the coming years. Although this is partly due to a more limited scope for rapid catch-up growth compared to many other SSA economies, given South Africa's relatively higher GDP per capita, it is also a consequence of the country's multiple structural weaknesses. Deep reforms to improve the power supply, reduce sky-high unemployment, improve the transport system and reduce inequality will be required to substantially improve South Africa's growth potential.
South Africa's Macroeconomic Analysis:
Nominal GDP of USD 400 billion in 2024.
Nominal GDP of USD 381 billion in 2023.
Nominal GDP of USD 400 billion in 2024.
GDP per capita of USD 6,331 compared to the global average of USD 10,589.
GDP per capita of USD 6,331 compared to the global average of USD 10,589.
GDP per capita of USD 6,111 compared to the global average of USD 10,589.
Average real GDP growth of 0.9% over the last decade.
Average real GDP growth of 0.8% over the last decade.
Average real GDP growth of 0.8% over the last decade.
Sector Analysis
In 2022, services accounted for 63.0% of overall GDP, manufacturing 12.9%, other industrial activity 21.6%, and agriculture 2.5%. Looking at GDP by expenditure, private consumption accounted for 64.7% of GDP in 2023, government consumption 19.7%, fixed investment 15.6%, and net exports 0.0%.International trade
In 2023, manufactured products made up 40.5% of total merchandise exports, mineral fuels 10.7%, food 11.7%, ores and metals 29.1% and agricultural raw materials 2.0%, with other categories accounting for 6.0% of the total. In the same period, manufactured products made up 60.6% of total merchandise imports, mineral fuels 21.0%, food 6.3%, ores and metals 2.3% and agricultural raw materials 0.9%, with other goods accounting for 8.9% of the total. Total exports were worth USD 111.50 billion in 2024, while total imports were USD 99.70 billion.Main Economic Indicators
Economic growthThe economy recorded average annual growth of 0.9% in the decade to 2023. The COVID-19 pandemic caused a significant contraction in 2020. By 2022, the economy showed signs of recovery, but growth remained tepid by Sub-Saharan African standards. To read more about GDP growth in South Africa, go to our dedicated page.
Fiscal policy
South Africa's fiscal deficit averaged 5.0% of GDP in the decade to 2022. The COVID-19 pandemic further strained public finances, leading to increased borrowing and debt. Find out more on our dedicated page.
Unemployment
The unemployment rate averaged 28.6% in the decade to 2023. Structural issues, including skill mismatches and labor market rigidities, contributed to high unemployment rates, particularly among the youth. The COVID-19 pandemic exacerbated these challenges, leading to record unemployment levels. Despite some economic recovery post pandemic, unemployment remains a critical issue, compounded by economic inequality and a sluggish growth rate. For more information on South Africa's unemployment click here.
Inflation
Inflation averaged 5.1% in the decade to 2024. The decade was marked by economic challenges including currency volatility, wage pressures and energy shortages, which contributed to inflation. Despite various monetary policy interventions, inflation frequently exceeded 5%, driven by factors like rising energy costs, wage pressures, and political instability. Go to our South Africa inflation page for extra insight.
Monetary Policy
South Africa's monetary policy rate ended 2024 at 7.75%, up from 5.75% a decade earlier. Initially, rates were increased to combat inflation and stabilize the Rand. However, in 2020, in response to the COVID-19 economic fallout, rates were significantly reduced to historic lows to support economic growth. By 2022, as the economy began recovering and inflationary pressures emerged, the central bank started increasing rates. See our South Africa monetary policy page for additional details.
Exchange Rate
From end-2014 to end-2024 the rand weakened by 38.6% vs the U.S. dollar.The Rand's volatility was exacerbated during periods of global economic stress, notably during the 2020 COVID-19 pandemic. For more info on the rand, click here.
Economic situation in South Africa
The economy tapped the brakes in Q1. Seasonally adjusted quarter-on-quarter GDP growth decelerated to a near-halt, although it still managed to top market expectations of a slight contraction. The slowdown was primarily due to a softer rise in private consumption—which accounts for roughly two-thirds of GDP—pressured by higher unemployment and inflation rates. Moving to Q2, our Consensus is for sequential GDP growth to inch down slightly from Q1. Floods and snow since 9 June have disrupted activity and killed several, driving the government to recently declare a national emergency. More positively, in April, lower inflation and interest rates lifted retail sales from Q1’s average, while manufacturing rebounded. In other news, the country announced a planned USD 230 million upgrade and expansion of Cape Town Harbor, boding well for construction and trade.South Africa Economic Forecasts
Projections out to 2034.54 indicators covered including both annual and quarterly frequencies.
Consensus Forecasts based on a panel of 28 expert analysts.
Want to get insight on the economic outlook for South Africa in the coming years? FocusEconomics collects projections out to 2034 on 54 economic indicators for South Africa from a panel of 28 analysts at the leading national, regional and global forecast institutions. These projections are then validated by our in-house team of economists and data analysts, and averaged to provide one Consensus Forecast you can rely on for each indicator. This means you avoid the risk of relying on out of date, biased or outlier forecasts. Our Consensus Forecasts can be visualized in whichever way best suits your needs, including via interactive online dashboards , direct data delivery and executive-style reports which combine analysts' projections with timely written analysis from our in-house team of economists on the latest developments in the South Africa economy. To download a sample report on the South Africa's economy, click here. To get in touch with our team for more information, fill in the form at the bottom of this page.
South Africa Economic Indicators
Frequently Asked Question about South Africa's Economy
Is South Africa facing an economic crisis?
What is the main economic system of South Africa?
Is South Africa doing well economically?
South Africa is not currently experiencing a full-blown economic crisis, but it is facing significant economic challenges that could lead to one if they are not addressed. These challenges include high unemployment, inequality, frequent power outages, infrastructure crises affecting ports and railways, and climate change vulnerability. The economy has also been slow to recover from the COVID-19 pandemic.
South Africa has a mixed economic system, characterized by a blend of private enterprise and government intervention. The private sector plays a dominant role in the economy, but the government also maintains a significant presence through ownership of state-owned enterprises and regulation of various industries.
South Africa's economic performance is varied; the country has a sizeable economy by Sub-Saharan African standards and upper-middle-income status but is burdened by high unemployment, inequality, and a weak currency. Despite a stable financial system and a growing services sector, slow and uneven economic growth and limited foreign investment indicate that its overall economic health is not robust.