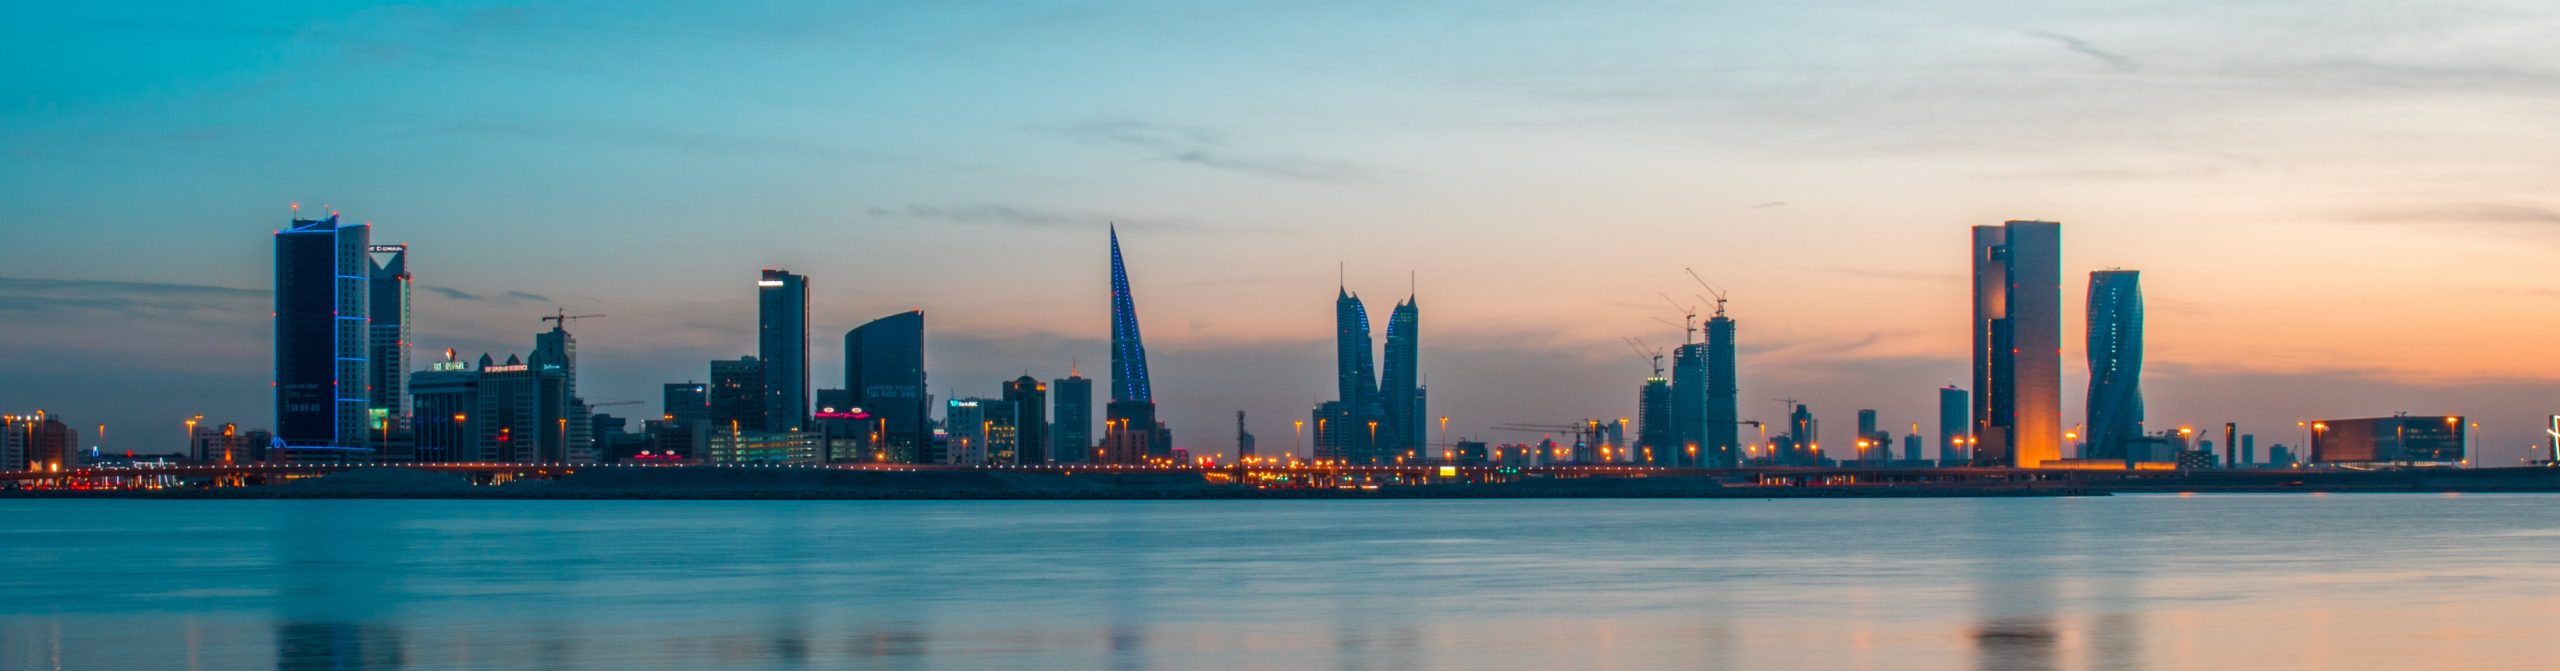
Bahrain Economic Outlook
A financial and oil-based economy:
Bahrain has a relatively diversified economy compared to its Gulf neighbors, with strong financial services, tourism, and manufacturing sectors complementing its oil industry. However, oil still plays a crucial role, contributing a significant share of government revenue. The country has been working to reduce its dependence on fossil fuels through economic reforms and increased investment in non-oil industries.
Financial services and regional trade hub:Bahrain has established itself as a key financial center in the Gulf, with a well-regulated banking sector and a business-friendly environment. The country has also leveraged its location and free trade agreements to position itself as a logistics and trade hub. However, competition from Dubai and Riyadh has challenged Bahrain’s role as a regional financial leader.
Public debt and fiscal concerns:Bahrain has one of the highest debt-to-GDP ratios in the Gulf, exceeding 100% in recent years. The country has relied on financial support from neighboring Saudi Arabia, the UAE, and Kuwait to stabilize its economy. While fiscal reforms, including VAT implementation and subsidy reductions, have helped improve government finances, public spending remains high.
Bahrain’s economic outlook:Economic growth in Bahrain is expected to be moderate, supported by financial services, manufacturing, and increased tourism. However, long-term sustainability will depend on fiscal discipline, further economic diversification, and continued reforms. Reducing public debt and maintaining competitiveness in the financial sector will be key to ensuring stability.
Bahrain's Macroeconomic Analysis:
Nominal GDP of USD 46.0 billion in 2023.
GDP per capita of USD 29,057 compared to the global average of USD 10,589.
Average real GDP growth of 2.8% over the last decade.
Sector Analysis
In 2022, services accounted for 51.1% of overall GDP, manufacturing 19.8%, other industrial activity 28.8%, and agriculture 0.3%. Looking at GDP by expenditure, private consumption accounted for 39.2% of GDP in 2021, government consumption 15.8%, fixed investment 25.6%, and net exports 19.4%.International trade
In 2023, manufactured products made up 28.6% of total merchandise exports, mineral fuels 0.3%, food 8.3%, ores and metals 62.3% and agricultural raw materials 0.1%, with other categories accounting for 0.4% of the total. In the same period, manufactured products made up 57.3% of total merchandise imports, mineral fuels 3.4%, food 13.9%, ores and metals 20.5% and agricultural raw materials 0.6%, with other goods accounting for 4.3% of the total. Total exports were worth USD 24.20 billion in 2024, while total imports were USD 20.60 billion.Main Economic Indicators
Economic growthThe economy recorded average annual growth of 2.9% in the decade to 2023. To read more about GDP growth in Bahrain, go to our dedicated page.
Fiscal policy
Bahrain's fiscal deficit averaged 11.2% of GDP in the decade to 2023. Find out more on our dedicated page.
Unemployment
The unemployment rate averaged 4.9% in the decade to 2023. For more information on Bahrain's unemployment click here.
Inflation
Inflation averaged 1.2% in the decade to 2024. Go to our Bahrain inflation page for extra insight.
Monetary Policy
Bahrain's monetary policy rate ended 2024 at 5.25%, up from 0.50% a decade earlier. See our Bahrain monetary policy page for additional details.
Exchange Rate
From end-2014 to end-2024 the dinar stayed on the same level vs the U.S. dollar. For more info on the dinar, click here.
Economic situation in Bahrain
GDP expanded 2.6% in annual terms in the first half of 2025 according to the latest national accounts figures. The non-energy sector—which accounts for over 80% of GDP—was the key driver, with brisk growth seen in subsectors including construction, finance, hospitality and wholesale plus retail trade. Tailwinds included foreign direct investment, strong tourism activity, and interest rate cuts since early 2024. In contrast, the energy sector’s performance was inconsistent, with a brief expansion in Q1 followed by contraction in Q2 as both natural gas and oil output declined. Looking at data for the second half of the year, oil production returned to growth in July, while the value of sales transactions by domestic and foreign cardholders was notably stronger in July–August compared to the same period a year earlier, hinting at healthy private spending and tourist arrivals.Bahrain Economic Forecasts
Projections out to 2035.43 indicators covered including both annual and quarterly frequencies.
Consensus Forecasts based on a panel of 18 expert analysts.
Want to get insight on the economic outlook for Bahrain in the coming years? FocusEconomics collects projections out to 2035 on 43 economic indicators for Bahrain from a panel of 18 analysts at the leading national, regional and global forecast institutions. These projections are then validated by our in-house team of economists and data analysts, and averaged to provide one Consensus Forecast you can rely on for each indicator. This means you avoid the risk of relying on out of date, biased or outlier forecasts. Our Consensus Forecasts can be visualized in whichever way best suits your needs, including via interactive online dashboards , direct data delivery and executive-style reports which combine analysts' projections with timely written analysis from our in-house team of economists on the latest developments in the Bahrain economy. To download a sample report on the Bahrain's economy, click here. To get in touch with our team for more information, fill in the form at the bottom of this page.