The global economy, much like the weather, is prone to cycles of sunshine and storm. For businesses, investors and policymakers, discerning the approach of an economic tempest—a recession—is paramount. But how does one read these financial skies? The answer lies in a constellation of economic indicators, data points that, when interpreted correctly, can offer crucial foresight. Ignoring them is akin to sailing into unchartered waters without a compass. To see where these indicators are pointing next in one concise view, see our Consensus Forecast.
What Exactly Are Recession Indicators—And Why Should You Care?
At its simplest, a recession indicator is an economic statistic that historically exhibits a discernible pattern before or during periods of a recession.
Thus, to understand what a recession indicator is, we first have to understand what a recession is. The most widely accepted definition of a recession in America comes from the National Bureau of Economic Research (NBER), a private non-profit organization that specializes in economic analysis. It defines a recession as “a significant decline in economic activity spread across the economy, lasting more than a few months, normally visible in real gross domestic product (GDP), real income, employment, industrial production, and wholesale-retail sales.” A more common, though narrower and less nuanced, rule of thumb is two consecutive quarters of shrinking GDP.
Recession indicators are, in essence, the economy’s vital signs. They range from complex financial market signals to more tangible measures like employment figures and consumer sentiment. Some are considered “leading” indicators, changing before the broader economy does, offering a glimpse into the future. Others are “coincident,” moving in tandem with the economic cycle, or “lagging,” shifting only after a trend is well established.
Why should the average citizen, business leader or investor care? Because the implications of a recession are profound and pervasive. For individuals, it can mean job losses, wage stagnation and diminished investment returns. For businesses, it translates to falling demand, squeezed profit margins and potentially painful decisions about layoffs or shelved expansion plans. Governments, meanwhile, face reduced tax revenues and increased demand for social safety nets, often while grappling with how to stimulate a flagging economy.
Understanding these indicators, therefore, is not merely an academic exercise. It is about preparedness. Recognizing the warning signs allows for proactive adjustments: shoring up personal finances, re-evaluating business strategies, or, for policymakers, considering pre- emptive fiscal or monetary interventions. In a world of economic uncertainty, these indicators are indispensable tools for navigating the path ahead.
The Most Important Recession Indicators You Need to Watch Right Now:
While a vast array of data points vie for attention, only a few have consistently proven their mettle as reliable, if not infallible, harbingers of economic downturns.
Yield Curve Inversion
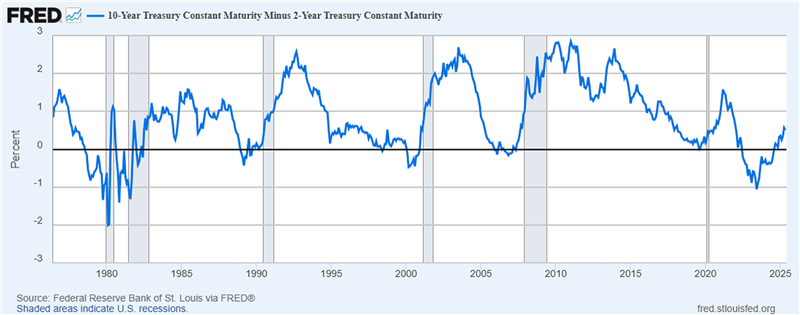
Perhaps the most closely watched, and often uncannily accurate, predictor is the inversion of the yield curve. Typically, investors demand higher compensation (yield) for tying up their money for longer periods. Thus, long-term bonds (e.g., 10-year Treasuries) usually offer higher yields than short-term bonds (e.g., two-year Treasuries or three-month T-bills).
An inversion occurs when this relationship flips: Short-term yields rise above long-term yields. This peculiar state of affairs signals that investors expect interest rates to fall in the future, a scenario often prompted by an anticipated economic slowdown that would compel the Central Bank to cut its benchmark rate. Essentially, bond markets are betting on a weaker future economy.
The spread between the 10-year and two-year Treasury yields is a popular gauge; its inversion has preceded every U.S. recession since the 1970s, typically with a lead time of 6 to 24 months. Another keenly observed spread is the 10-year versus the 3-month T-bill, favored by some economists, including those at the Federal Reserve, for its predictive power. While not a guarantee—no indicator is—a sustained inversion is a powerful red flag that warrants serious attention. It reflects a collective, market-driven pessimism about future growth prospects, making it a uniquely potent signal.
Rising Unemployment
The labor market is a cornerstone of economic health. When businesses feel confident about future demand, they hire. When they anticipate a slowdown, hiring freezes and layoffs often follow. Consequently, rising unemployment is a classic, though often more “coincident” or slightly “lagging”, indicator of recession.
In the U.S., key metrics to watch include the monthly non-farm payrolls report, which details job gains or losses across sectors, and weekly initial jobless claims, which provide a more timely albeit volatile pulse of layoffs. A sustained increase in initial claims, perhaps rising by 20–25% from their cyclical low, can be an early warning that recession could be on the way.
Economist Claudia Sahm proposed a simple but effective rule: A recession is likely underway or imminent when the three-month moving average of the national unemployment rate rises by 0.5 percentage points or more relative to its low during the previous 12 months. This “Sahm Rule” has historically identified recessions with remarkable accuracy and timeliness, often triggering before official NBER declarations. The logic is straightforward: significant job losses curtail consumer spending, which forms the bedrock of most developed economies (around 70% of U.S. GDP), creating a negative feedback loop.
Consumer Confidence and Spending
If the labor market reflects the ability of consumers to spend, consumer confidence gauges their willingness. Surveys like the University of Michigan Consumer Sentiment Index and the Conference Board Consumer Confidence Index measure how optimistic households are about their financial situation and the broader economy. A sharp, sustained decline in these indices often precedes a drop in actual spending.
When consumers feel anxious about job security, inflation or the economic outlook, they tend to tighten their purse strings, postponing discretionary purchases like cars, holidays or home renovations. This caution directly impacts retail sales and Personal Consumption Expenditures (PCE), a broad measure of consumer spending. Stagnant or falling retail sales, especially for big-ticket items, are a clear sign of waning economic momentum. The interconnectedness is clear: job losses (or fear thereof) dent confidence, which in turn curtails spending, further weakening demand and potentially leading to more job losses. This self-reinforcing cycle is a hallmark of recessions.
Stock Market Moves and Credit Conditions
The stock market is often described as a forward-looking mechanism, as it takes into account future corporate earnings and economic growth. While notoriously volatile and prone to overreactions, significant and sustained market downturns (bear markets, typically a 20% fall from a peak) have frequently preceded or coincided with recessions. Investors, sensing troubled times ahead, sell riskier assets like equities. The CBOE Volatility Index (VIX), often called the “fear gauge,” can also spike during periods of market stress and economic uncertainty.
However, the stock market has also “predicted nine of the last five recessions”, as the old joke goes, highlighting its tendency for false alarms. More telling, perhaps, are changes in credit conditions. When lenders become nervous, they tighten lending standards, making it harder and more expensive for businesses and consumers to borrow. This can be seen in widening credit spreads—the difference in yield between riskier corporate bonds (e.g., BBB-rated) and safer government bonds. A significant increase in these spreads indicates that investors are demanding much higher compensation for bearing credit risk, signaling concerns about corporate defaults. Similarly, surveys of bank loan officers can reveal if banks are becoming more cautious in their lending practices. A credit crunch, in turn, can starve the economy of the funds needed for investment and consumption, tipping it into recession.
Spotting Early Warning Signs: Can You Predict a Recession Before It Hits?
The quest to reliably predict recessions is the economist’s equivalent of the search for the Holy Grail. While the indicators discussed above offer valuable clues, no single signal is foolproof. The economy is a complex, dynamic system influenced by a multitude of factors, including geopolitical events, technological disruptions and policy responses, which can alter historical relationships.
The most prudent approach involves looking for a confluence of warning signs across multiple indicators rather than relying on a single metric. For instance, an inverted yield curve, coupled with declining consumer confidence and a noticeable uptick in jobless claims, paints a far more convincing picture of an impending slowdown than any one of these signals in isolation. Think of it as a doctor diagnosing an illness: A single symptom might be inconclusive, but a pattern of related symptoms points towards a specific condition.
Organizations like The Conference Board compile Leading Economic Indexes (LEI), which amalgamate several leading indicators (including manufacturing orders, building permits, average weekly hours worked and the yield spread) into a single composite figure. A persistent decline in the LEI is considered a strong recessionary signal.
However, even with a dashboard of indicators, prediction remains an art as much as a science. The “this time is different” syndrome is a constant peril, as structural changes in the economy can sometimes render old rules of thumb less effective. Furthermore, the actions of central banks and governments can influence outcomes. Aggressive monetary easing or fiscal stimulus might avert a recession that indicators previously suggested was on the horizon, or at least mitigate its severity. Therefore, while indicators flash warnings, the human element of policy response adds another layer of complexity to the predictive challenge.
Smart Moves for Investors and Advisors When Recession Indicators Flash Red
When the economic skies darken and recession indicators begin to flash red, panic is the enemy. Instead, a measured, strategic response is required.
For Investors:
- Resist Panic Selling: Market timing is notoriously difficult. Selling everything after a downturn often locks in losses and risks missing the eventual recovery. A long-term perspective is crucial.
- Review Asset Allocation: This doesn’t mean wholesale changes but rather a potential rebalancing. Consider tilting towards more defensive sectors (consumer staples, healthcare, utilities) that tend to perform relatively well during downturns. High-quality bonds can also provide a haven and diversification.
- Build/Maintain Cash Reserves: Having some “dry powder” allows investors to weather personal financial storms (like job loss) without liquidating investments at inopportune times. It also provides capital to take advantage of lower asset prices during a market slump.
- Consider Dollar-Cost Averaging: Investing a fixed amount regularly, regardless of market fluctuations, can reduce the risk of investing a lump sum at a market peak and ensures you buy more shares when prices are low.
- Focus on Quality: In uncertain times, companies with strong balance sheets, sustainable earnings and solid business models tend to be more resilient.
For Advisors:
- Proactive Communication: Reach out to clients before they become overly anxious. Explain the current economic environment, what the indicators suggest, and how their portfolio is positioned.
- Revisit Financial Plans and Risk Tolerance: Recession risk is an opportune moment to review clients’ long-term goals and ensure their current investment strategy aligns with their capacity and willingness to tolerate risk.
- Stress-Test Portfolios: Model how client portfolios might perform under various recessionary scenarios. This can help manage expectations and identify potential vulnerabilities.
- Educate and Provide Context: Remind clients that economic cycles are normal. Provide historical context on recessions and subsequent recoveries to help them maintain a long-term perspective.
- Advise Against Emotional Decisions: Emphasize the importance of sticking to a well-thought-out financial plan rather than making impulsive changes based on fear or market noise. Help them distinguish between signal and noise from the array of indicators.
Ultimately, recession indicators are not crystal balls. They are economic weather vanes, providing valuable, if imperfect, signals of shifting economic winds. By understanding what they measure, by acknowledging their historical predictive power and by combining their insights with a disciplined strategy, individuals, businesses and their advisors can better navigate the inevitable ebb and flow of the economic cycle, turning potential peril into informed preparedness. The goal is not to avoid all storms—an impossibility—but to be ready with the right charts and a steady hand on the tiller.